
Uncover the top 10 technical analysis tools for successful trading and take your trading journey to the next level!
Trading can be a daunting journey, even for seasoned investors. Navigating the ever-fluctuating market requires not only a keen understanding of finance but also a set of effective tools. In this realm, technical analysis reigns supreme, offering invaluable insights into historical price movements and potential future trends.
By analyzing charts and patterns, technical analysis helps traders anticipate market shifts, identify potential trading opportunities, and ultimately, make informed decisions. However, the sheer volume of data and diverse indicators can be overwhelming, especially for beginners. That’s where the right tools come in – acting as your guide and support system, empowering you to translate complex data into actionable insights.
Understanding Technical Analysis
Technical analysis, a cornerstone of successful trading, involves studying historical market data to identify patterns and predict future price movements. Imagine it like reading a chart to understand the market’s language. By analysing price movements, volume, and other indicators, you can gain insights into market psychology and make informed trading decisions.
Top 10 Technical Analysis Tools
- Moving Average (MA)
This simple tool calculates the average price of a security over a specific period, smoothing out price fluctuations and revealing the underlying trend. Traders use MAs to identify support and resistance levels, confirm trends, and generate buy and sell signals.
Features
- Customizable period (e.g., 50-day, 200-day)
- Displays trend direction and potential reversals
- Identifies support/resistance levels
- Applicable to any timeframe
Benefits
- Easy to understand and interpret
- Reduces noise and helps visualize price trends
- Suitable for both short- and long-term trading
Functionalities
- Identifying potential entry and exit points
- Confirming trend breakouts and reversals
- Measuring momentum and strength of a trend
Example: A rising 50-day MA suggests an uptrend, while a falling 200-day MA indicates a downtrend.
- Exponential Moving Average (EMA)
Similar to the MA but places more weight on recent prices, making it more responsive to current trends. This can be helpful for identifying short-term trading opportunities.
Features
- Reacts faster to price changes than MA
- Offers a more accurate picture of short-term trends
- Useful for identifying overbought/oversold conditions
Benefits
- Captures recent price movements effectively
- Provides a smoother and less volatile representation of price
- Ideal for day trading and swing trading
Functionalities
- Identifying short-term entry and exit points
- Gauging market sentiment and momentum
- Filtering out noise and focusing on recent trends
Example: A rising 10-day EMA within a rising 50-day MA suggests a strong uptrend with potential for further momentum.
- Relative Strength Index (RSI)
This oscillator measures the magnitude of recent price changes to identify overbought and oversold conditions. Readings above 70 indicate overbought zones, while readings below 30 suggest oversold situations.
Features
- Predicts potential price reversals
- Identifies overbought/oversold situations
- Measures relative strength of a trend
Benefits
- Provides insights into market sentiment
- Helps identify potential corrections and pullbacks
- Useful for confirming trend breakouts or reversals
Functionalities
- Timing entry and exit points based on overbought/oversold zones
- Identifying divergences between price and RSI to predict reversals
- Combining with other indicators for a more comprehensive analysis
Example: An RSI above 70 in an uptrend suggests a potential correction, while an RSI below 30 in a downtrend indicates a possible reversal.
- Stochastic Oscillator
This indicator compares the closing price of a security to its price range over a specific period, signalling potential turning points in price trends. Oversold conditions are indicated by values below 20, and overbought levels by values above 80.
Features
- Identifies overbought/oversold zones
- Offers insights into short-term momentum
- Helps confirm price reversals
Benefits
- Useful for identifying trading opportunities based on momentum shifts
- Provides a contrarian perspective to identify potential corrections
- Effective for day trading and swing trading
Functionalities
- Timing entry and exit points based on overbought/oversold zones
- Identifying divergences between price and Stochastic Oscillator
- Combining with other indicators for confirmation and validation
Example: A Stochastic Oscillator above 80 in an uptrend suggests a potential overbought condition and a possible pullback, while a reading below 20 in a downtrend indicates a possible oversold rebound.
- Bollinger Bands
This volatility indicator uses moving averages and standard deviations to create bands around a security’s price. Tight bands suggest low volatility, while widening bands indicate increased volatility. Traders use Bollinger Bands to identify potential breakouts and price reversals.
Features
- Bollinger Bands are plotted as three lines: an upper and lower band surrounding a moving average (typically 20-period).
- The bands widen as volatility increases and narrow during periods of low volatility.
- Bollinger Bands can be used to identify overbought and oversold conditions, as well as potential trend reversals.
Benefits
- Visually identifies volatility: The width of the bands provides a clear indication of market volatility.
- Identifies overbought/oversold conditions: When the price touches the upper band, it may be overbought, and a potential reversal may occur. Conversely, touching the lower band may indicate oversold conditions and a potential bounce.
- Provides trend confirmation: Bollinger Bands can confirm existing trends based on price movement within the bands.
Functionalities
- Identifying potential entry and exit points based on price action relative to the bands.
- Assessing momentum and trend strength by analyzing the angle and slope of the Bollinger Bands.
- Gauging potential volatility breakouts and reversals through band expansion and contraction.
Example: A narrowing Bollinger Band indicates consolidation, while a widening band suggests increased volatility and a potential breakout.
- MACD (Moving Average Convergence Divergence)
This indicator uses two moving averages and a histogram to identify trend direction, momentum, and potential buy and sell signals. Crossovers of the MACD line above the signal line indicate bullish momentum, while crossovers below the signal line suggest bearish momentum.
Features
- MACD is a momentum indicator composed of two moving averages: a fast (12-period) and slow (26-period) moving average, and a MACD histogram.
- The MACD line fluctuates above and below a signal line (9-period moving average of the MACD).
- Divergences between the MACD line and the signal line, or between the MACD and price action, can indicate potential trend reversals.
Benefits
- Detects changes in momentum and trend strength more quickly than moving averages.
- Helps identify potential buy and sell signals based on crossovers and divergences.
- Measures the strength of trends by analyzing the distance between the MACD line and the signal line.
Functionalities
- Identifying potential trend reversals through crossovers between the MACD line and the signal line.
- Gauging trend strength and momentum by analyzing the slope and divergence of the MACD lines.
- Confirming existing trends based on the direction and strength of the MACD histogram.
Example: A bullish crossover of the MACD line above the signal line indicates a potential buy signal, while a bearish crossover below the signal line suggests a sell signal.
- On-Balance Volume (OBV)
This indicator incorporates volume data into price analysis, identifying buying and selling pressure. Rising OBV suggests bullish sentiment, while falling OBV indicates bearish sentiment.
Features
- OBV accumulates volume based on price movement.
- Up days add volume to OBV, while down days subtract volume.
- OBV helps identify volume divergence, where the OBV trend differs from the price trend, which can signal potential reversals.
Benefits
- Analyzes volume flow to confirm or contradict price movement.
- Identifies hidden strength or weakness in a trend based on volume divergences.
- Provides a long-term perspective on market sentiment and accumulation/distribution of a security.
Functionalities
- Confirming or contradicting existing trends by comparing OBV movement with price action.
- Identifying potential trend reversals based on volume divergences.
- Assessing the sustainability and potential strength of a trend based on the slope and volume accumulation of OBV.
Example: A rising OBV alongside an uptrend confirms buying pressure and potentially higher prices. Conversely, a falling OBV despite a rising price might indicate a weak trend and potential reversal.
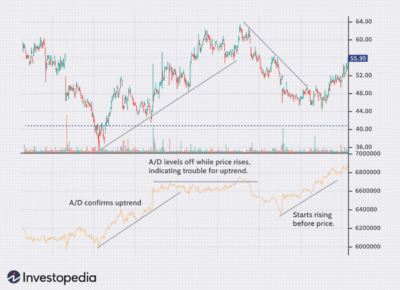
- A/D Line (Accumulation/Distribution Line)
This indicator analyses volume data based on the closing price of a security. Upward movement suggests accumulation and potential bullishness, while downward movement indicates distribution and potential bearishness.
Features
- A/D Line measures the money flow into and out of a security based on closing price and volume.
- An increasing A/D line indicates accumulation, potentially leading to price increases.
- Conversely, a decreasing A/D line suggests distribution, potentially leading to price declines.
Benefits
- Provides insights into investor sentiment and buying/selling pressure.
- Helps identify potential turning points in market trends based on changes in the A/D line direction.
- Offers confirmation of existing trends or potential divergences from price action.
Functionalities
- Identifying potential trend reversals based on A/D line divergences from price action.
- Assessing the strength of trends based on the slope and momentum of the A/D line.
- Analysing the accumulation/distribution of a security and potential future price movements.
Example: A rising A/D line despite a declining price might suggest accumulation and a potential oversold bounce. Conversely, a falling A/D line alongside a rising price might indicate distribution and a potential pullback.
- Average Directional Index (ADX):
This indicator measures trend strength, regardless of direction. Rising ADX values indicate a strong trend, while falling ADX values suggest a weak trend.
Features
- Oscillates between 0 and 100, with higher readings indicating stronger trends.
- Smooths out price fluctuations, providing a clearer view of trend direction.
- Applicable to any timeframe and asset class.
Benefits
- Identifies strong trends, providing valuable information for trend-based trading strategies.
- Helps filter out weak trends and choppy markets, reducing false signals.
- Can be combined with other indicators to confirm trend strength and potential reversals.
Functionalities
- Identifying potential trend breakouts and reversals.
- Gauging the momentum of a trend.
- Filtering trades based on trend strength.
- Confirming trading signals from other indicators.
Example: An ADX reading above 25 suggests a strong trend, while readings below 20 indicate a weak or nonexistent trend. Traders can use this information to enter trades during strong trends and avoid trading in choppy markets.
- Aroon Indicator
This indicator uses two lines to identify the beginning and end of trends. The Aroon Up line measures the number of periods since the most recent high, while the Aroon Down line measures the number of periods since the most recent low. Higher values on the Aroon Up line indicate a bullish trend, while higher values on the Aroon Down line suggest a bearish trend.
Features
- Displays two lines oscillating between 0 and 100.
- Aroon Up indicates the number of periods since the highest high.
- Aroon Down indicates the number of periods since the lowest low.
Benefits
- Identifies potential trend reversals early, allowing traders to take timely action.
- Measures the strength of existing trends, helping traders confirm their trading decisions.
- Can be used to identify overbought and oversold conditions in the market.
Functionalities
- Identifying potential buy and sell signals based on the crossing of Aroon Up and Aroon Down lines.
- Gauging the momentum and strength of a trend.
- Filtering trades based on trend direction and strength.
- Confirming trading signals from other indicators.
Example: A rising Aroon Up line and a falling Aroon Down line suggest an uptrend, while the opposite scenario indicates a downtrend. Crossovers of these lines can signal potential trend reversals.
Technical Analysis Tool Matching with Trading Platforms:
| Tech. Analysis Tool | Best Trading Platform | Reasons |
| Moving Average (MA) | All Platforms | Widely supported, simple to understand, identifies trends. |
| Exponential Moving Average (EMA) | All Platforms | Similar to MA, but reacts faster to price changes. |
| Relative Strength Index (RSI) | TradingView, thinkorswim | Measures overbought/oversold conditions, popular for swing trading. |
| Stochastic Oscillator | TradingView, MetaTrader 4 | Identifies overbought/oversold levels and momentum shifts, good for day trading. |
| Bollinger Bands | All Platforms | Measures volatility and potential breakouts, versatile for various strategies. |
| MACD (Moving Average Convergence Divergence) | TradingView, thinkorswim | Identifies trend strength, reversals, and momentum shifts, popular for swing trading. |
| On-Balance Volume (OBV) | TradingView, MetaTrader 4 | Analyzes volume flow to confirm trends and identify divergences. |
| A/D Line (Accumulation/Distribution Line) | TradingView, MetaTrader 4 | Similar to OBV, but uses closing price instead of volume. |
| Average Directional Index (ADX) | TradingView, thinkorswim | Measures trend strength, useful for identifying strong trends and potential reversals. |
| Aroon Indicator | MetaTrader 4, NinjaTrader | Identifies trend direction and maturity, less common but valuable for confirmation. |
The Bottom Line
Navigating the unpredictable landscape of trading demands a well-equipped arsenal. Technical analysis tools, serving as your guiding light, empower you to decipher market patterns, identify trading opportunities, and make informed decisions. From charting platforms to indicators like RSI and MACD, these instruments offer valuable insights into price movements and market sentiment. Remember, however, that technical analysis is not a crystal ball. It is a powerful tool, but ultimately, successful trading requires a multifaceted approach, incorporating fundamental analysis, risk management, and a disciplined mindset. So, delve into the world of technical analysis, master these tools, and embark on your journey towards achieving consistent trading success.